mirror of
https://github.com/NohamR/LLDBMemView.git
synced 2026-04-07 23:39:58 +00:00
main
LLDB Memory Region Parser
A web-based visualization tool for analyzing and parsing LLDB memory region output.
Note: This project was vibecoded and built in a rush to support another debugging task.
Purpose
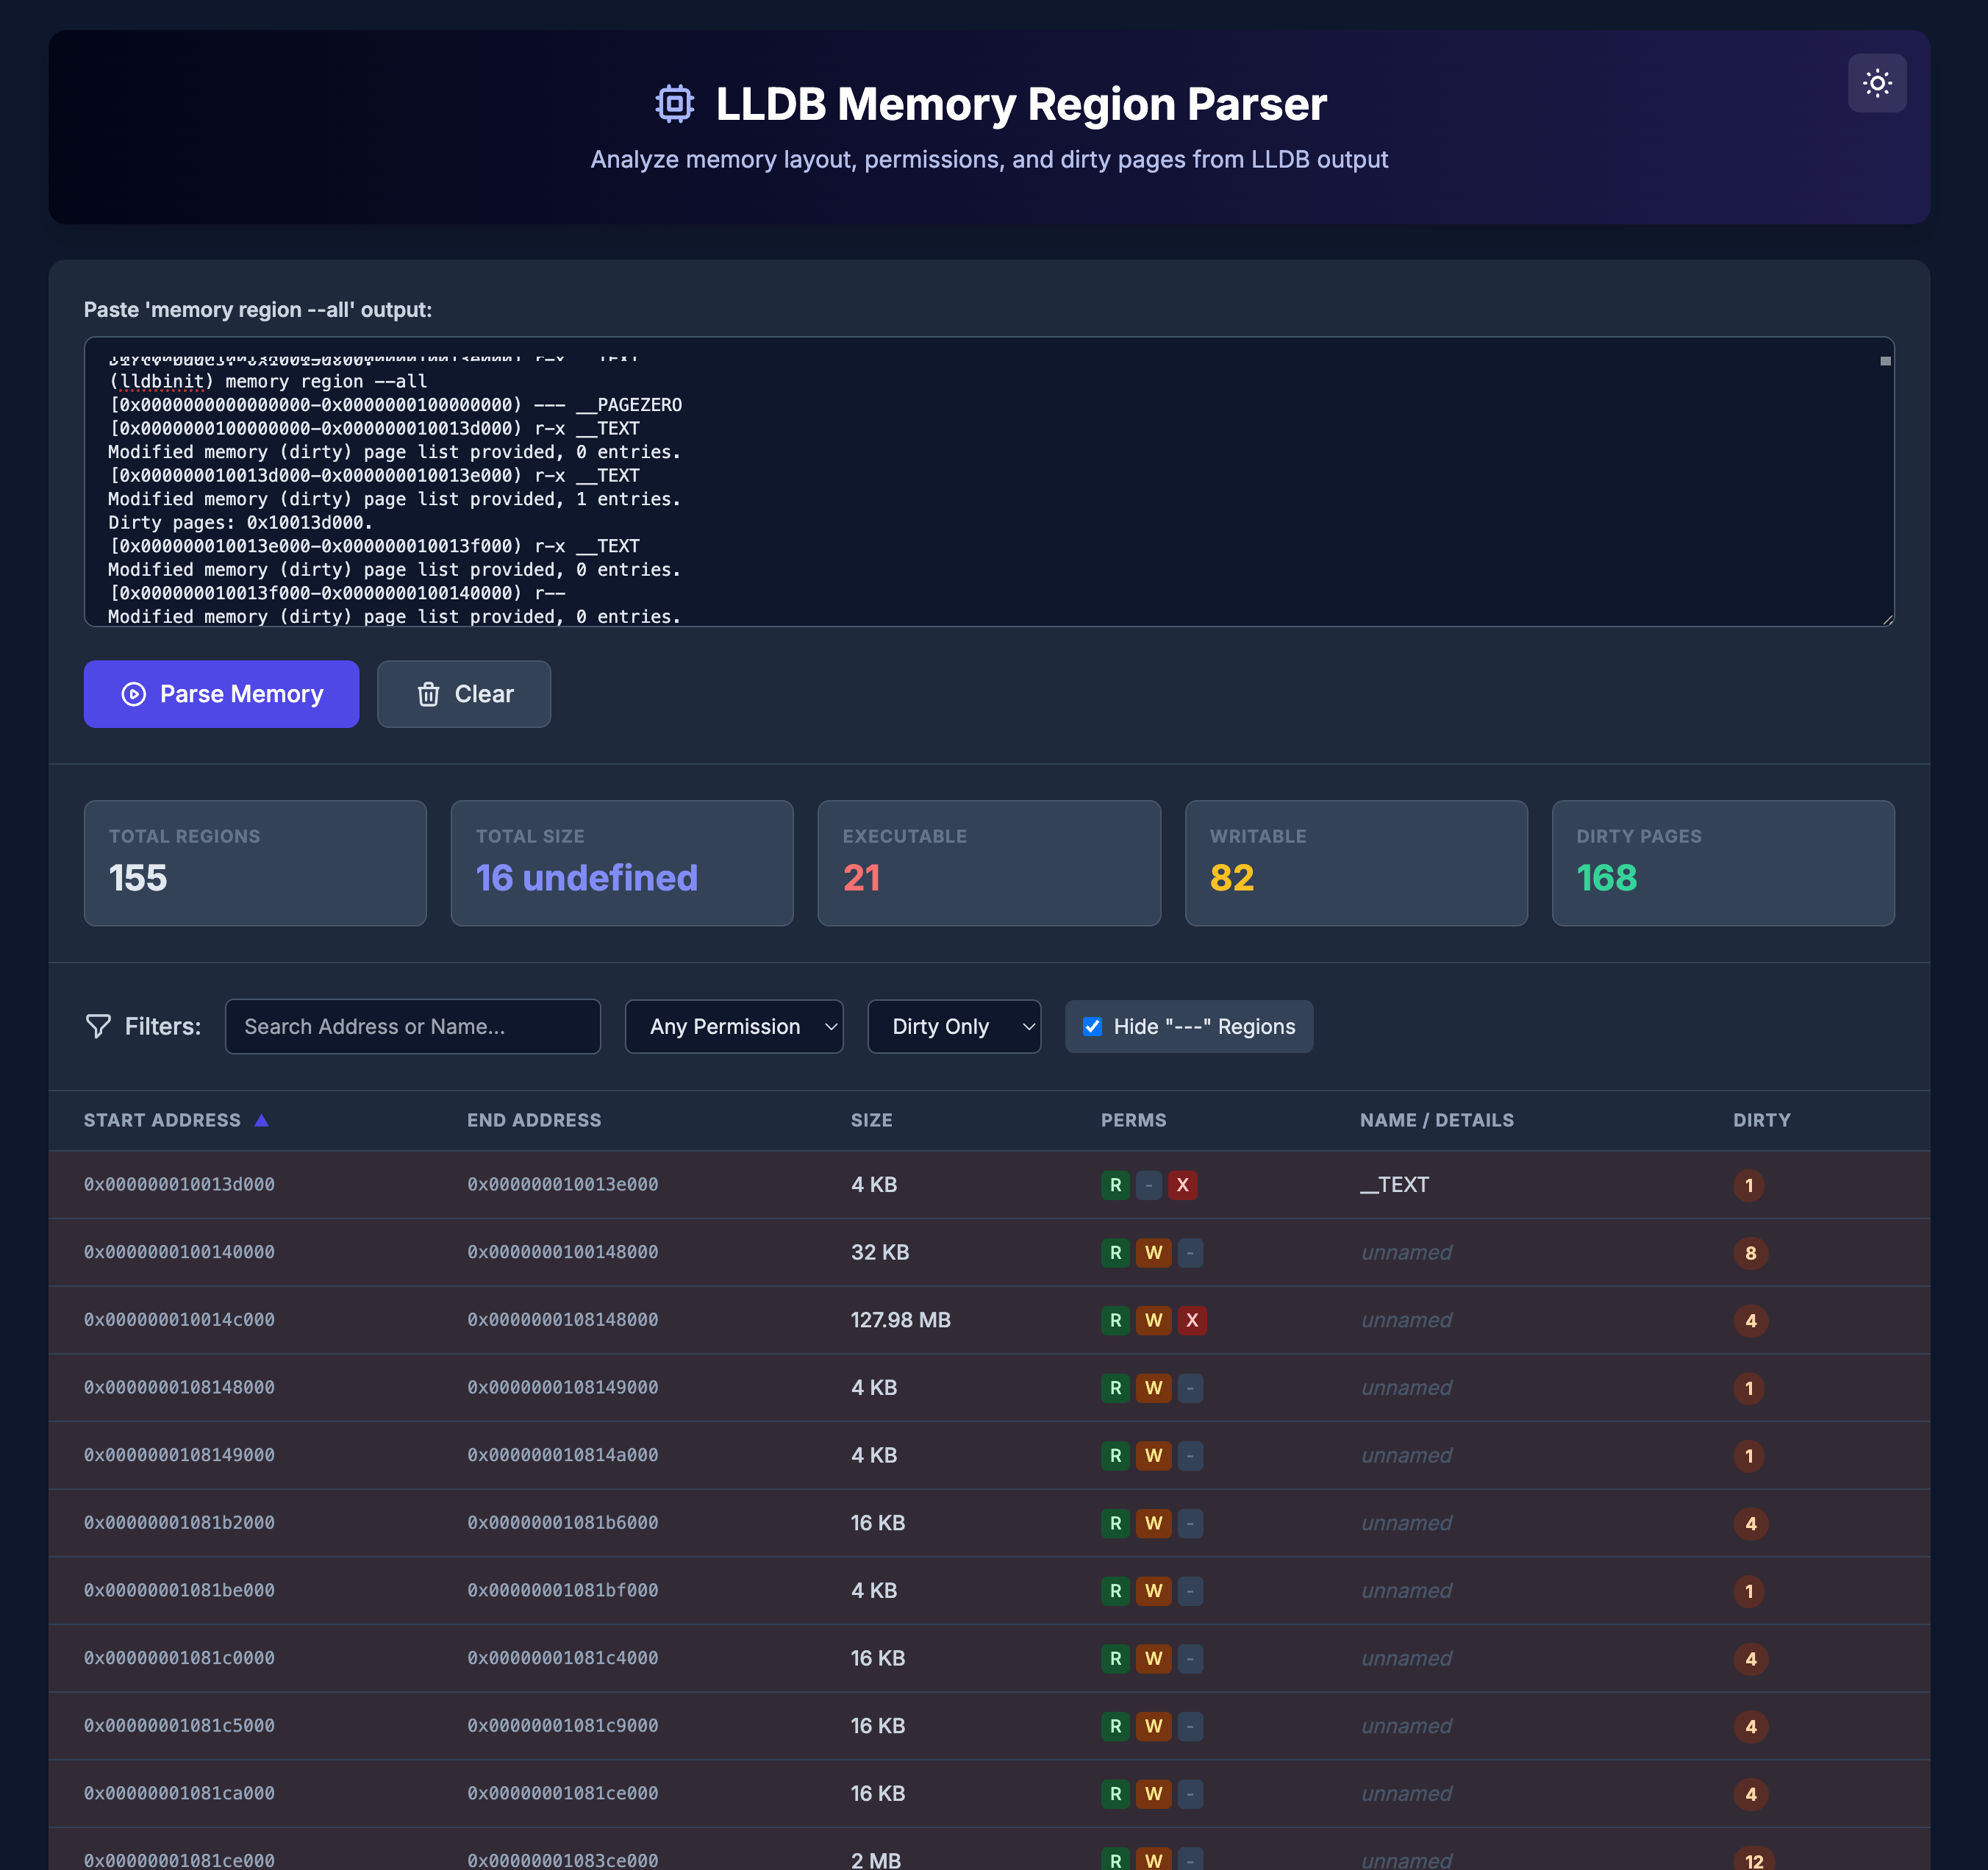
When debugging with LLDB, the memory region --all command outputs detailed information about process memory regions. This tool parses that raw output and presents it in a clean, interactive table with filtering, sorting, and statistics.
Usage
# In LLDB
(lldb) process attach --pid <pid>
(lldb) memory region --all
Copy the output that looks like:
[0x0000000100000000-0x0000000100004000) r-x __TEXT
[0x0000000100004000-0x0000000100008000) rw- __DATA
Dirty pages: 0x100004000, 0x100005000
...
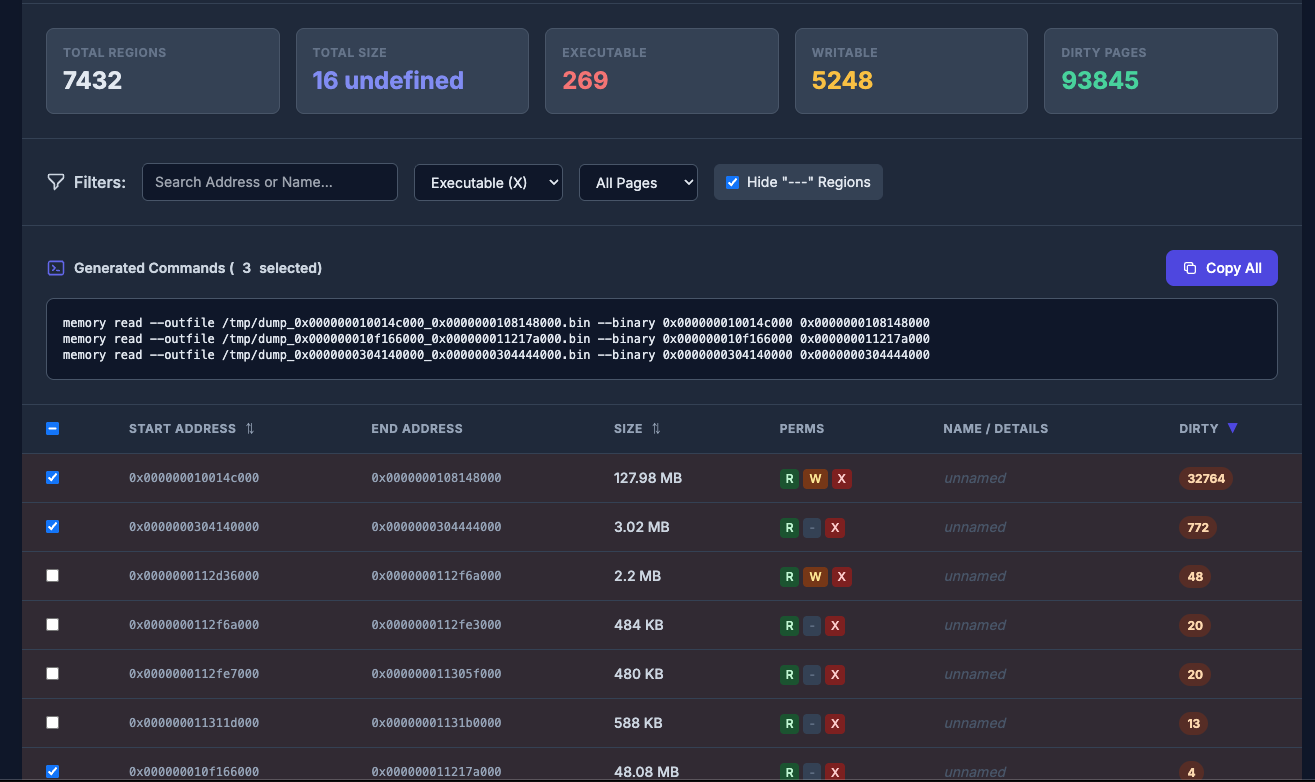
Then paste it into the input area of this tool to visualize the memory regions. Select rows using checkboxes (or select all), click Generate Commands to create memory dump commands. Paste and run commands in LLDB to dump memory regions to binary files
Features
- Interactive table: View all memory regions with start/end addresses, size, permissions, and dirty page counts
- Filtering and sorting: Filter by address, name, permissions, and dirty pages. Sort by any column
- Statistics dashboard: See total regions, total size, executable/writable counts, and dirty pages
- Dark mode: Toggle between light and dark themes
- Row selection: Select individual or all memory regions using checkboxes
- Command generation: Generate LLDB
memory readcommands for selected regions to dump memory to files- Format:
memory read --outfile /tmp/dump_<start>_<end>.bin --binary <start> <end> - Copy all commands to clipboard with one click
- Format:
Languages
JavaScript
50.7%
HTML
46.7%
CSS
2.6%

