mirror of
https://github.com/NohamR/LLDBMemView.git
synced 2026-02-22 02:25:43 +00:00
870 B
870 B
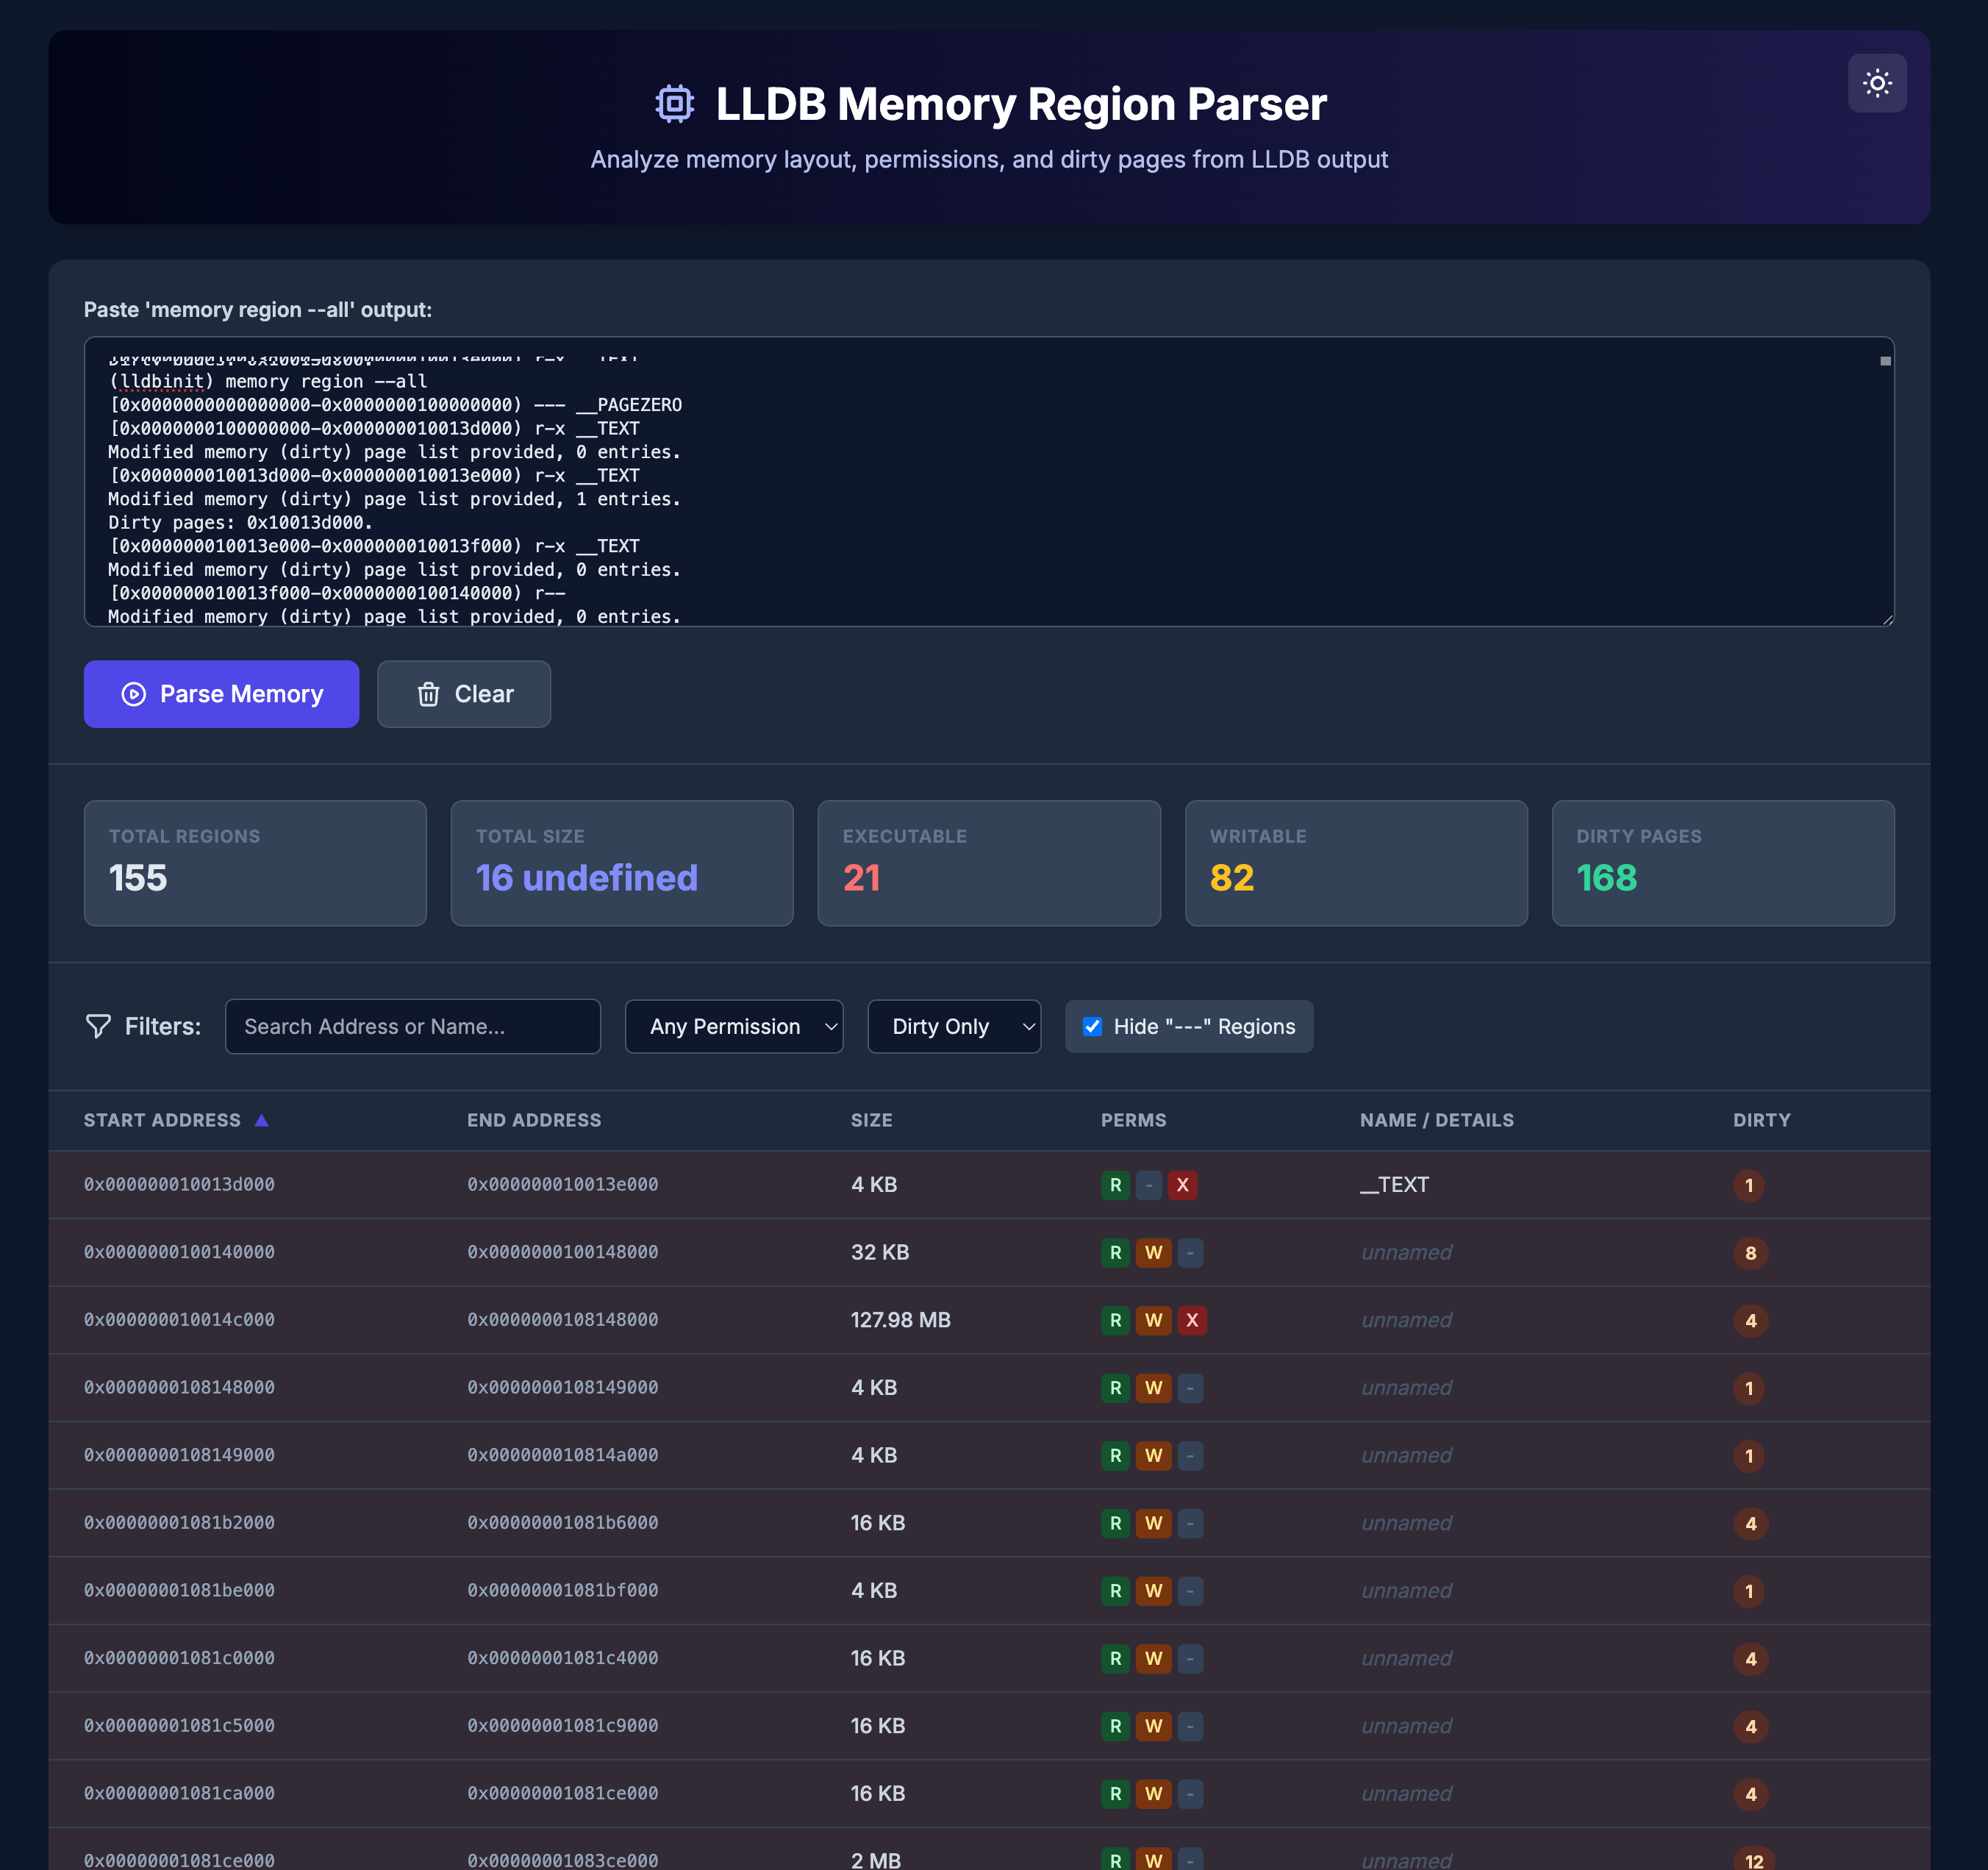
LLDB Memory Region Parser
A web-based visualization tool for analyzing and parsing LLDB memory region output.
Note: This project was vibecoded and built in a rush to support another debugging task.
Purpose
When debugging with LLDB, the memory region --all command outputs detailed information about process memory regions. This tool parses that raw output and presents it in a clean, interactive table with filtering, sorting, and statistics.
Usage
# In LLDB
(lldb) process attach --pid <pid>
(lldb) memory region --all
Copy the output that looks like:
[0x0000000100000000-0x0000000100004000) r-x __TEXT
[0x0000000100004000-0x0000000100008000) rw- __DATA
Dirty pages: 0x100004000, 0x100005000
...
Then paste it into the input area of this tool to visualize the memory regions.
